


Microsoft Dynamics 365 Business Central and Power BI: A Practical Guide to Better ERP Reporting

Microsoft Dynamics 365 Business Central and Power BI: A Practical Guide to Better ERP Reporting
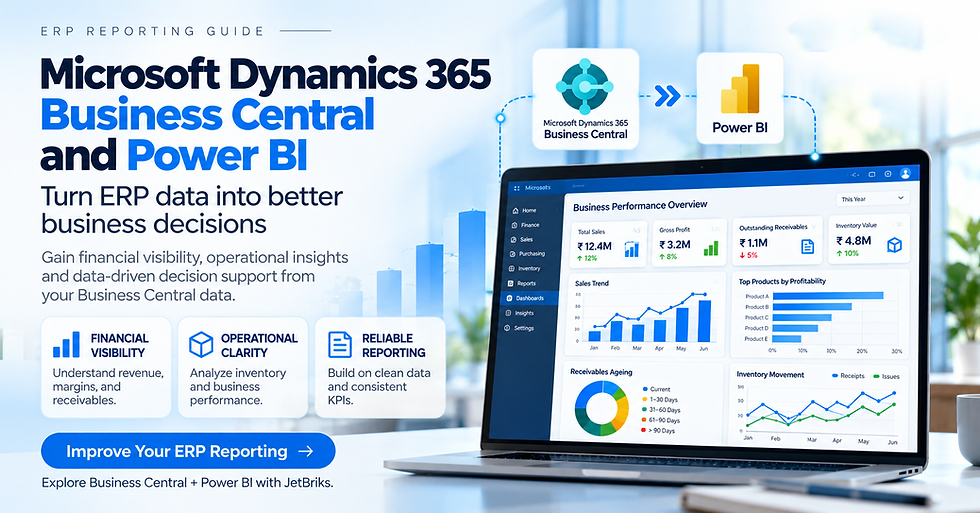
Businesses collect large amounts of operational and financial data through sales, purchasing, inventory, accounting, and customer transactions. But collecting data is only the beginning.
If your team still depends on manually prepared spreadsheets to understand profitability, overdue receivables, inventory performance, or sales trends, your business may not be getting the full value from its ERP data.
Microsoft Dynamics 365 Business Central and Microsoft Power BI can help connect everyday business transactions with reporting that supports better decisions.
The key is to start with reliable data, clearly defined KPIs, and the business questions your leadership team needs to answer.
What Is the Difference Between Business Central and Power BI?
Microsoft Dynamics 365 Business Central is an ERP solution that helps organizations manage financial and operational processes. Microsoft Power BI is a business analytics platform that helps users analyze data through reports, visualizations, and interactive dashboards.
Business Central | Power BI |
Records and manages business transactions | Analyzes and visualizes suitable data |
Supports finance, sales, purchasing, and inventory workflows | Helps identify trends, comparisons, and exceptions |
Provides operational and financial records | Presents selected KPIs for business analysis |
Supports day-to-day business processes | Supports reporting and management decisions |
Together, these technologies can help businesses move from transaction processing toward more informed analysis. The exact capabilities depend on the available data, connection method, licensing, permissions, and reporting configuration.
5 Ways Power BI Can Improve Business Central Reporting
1. Financial performance reporting
Finance teams need more than a list of transactions. They need to understand how financial performance changes over time.
Power BI reports can help visualize revenue, expenses, margins, budget comparisons, and financial trends using suitable Business Central data.
A well-designed report can help management identify significant variances and investigate what may be driving them.
2. Accounts receivable and overdue payments
Delayed customer payments can put pressure on working capital.
Reporting can help finance teams analyze outstanding balances, overdue invoices, payment trends, and customer-level exposure.
The report should use consistent ageing rules and accurate transaction data so that the results support meaningful collection priorities.
3. Inventory and stock movement analysis
Inventory decisions influence cash flow, customer service, and operational efficiency.
Depending on the available data, reports can help businesses analyze stock movements, inventory levels, purchasing patterns, and potential slow-moving items.
The objective is to identify questions that need attention—not simply display a large inventory table.
4. Sales and customer performance
Sales leaders may need to compare performance across products, customers, salespeople, territories, or time periods.
Power BI can provide interactive views that make it easier to examine trends and investigate changes.
Before designing the report, define how sales performance will be calculated and which transaction dates and categories should be included.
5. Operational performance monitoring
Businesses can use reporting to monitor selected operational indicators, such as order processing, purchasing activity, and fulfilment performance.
The right KPIs depend on the organization's workflows and priorities.
Each indicator should have a clear definition, an owner, and an action to take when performance falls outside the expected range.
Why ERP Dashboards Sometimes Produce Misleading Results
A dashboard can look professional and still provide unreliable information.
Common causes include:
Incomplete or inconsistent master data
Duplicate customer, vendor, or product records
Different departments using different KPI definitions
Data refreshes that do not meet reporting expectations
Missing business dimensions or classifications
Reports that cannot be reconciled with trusted source records
For example, two reports may show different sales totals because one uses invoice dates and the other uses order dates. Without a documented definition, users may incorrectly assume one of the reports is broken.
Before building dashboards, establish which data is authoritative and how each metric should be calculated.
How to Implement Business Central and Power BI Reporting
A structured approach helps prevent reporting projects from becoming unnecessarily complex.
Step 1: Identify the reporting problem
List the reports that take too long to prepare or the business questions that are difficult to answer.
Step 2: Define the required KPIs
Document each KPI's purpose, formula, data source, reporting period, and owner.
Step 3: Assess data quality
Review transaction completeness, master data, classifications, and consistency.
Step 4: Plan the data connection
Evaluate suitable supported connection methods, considering security, access permissions, refresh frequency, data volume, and technical requirements.
Step 5: Build a focused reporting pilot
Start with one high-priority area, such as finance, receivables, inventory, or sales.
Step 6: Validate report accuracy
Reconcile totals and calculations with trusted Business Central records before relying on the report for management decisions.
Step 7: Review adoption and business value
Measure whether the reports reduce manual work, improve visibility, and help users investigate important business questions.
Is Your Business Ready for Power BI Reporting?
Consider reviewing your current reporting approach if:
Your team regularly combines multiple spreadsheets.
Management reports require substantial manual preparation.
Departments disagree about important business figures.
Finance leaders struggle to investigate overdue receivables.
Inventory or sales performance is difficult to analyze consistently.
Your organization uses Business Central but has limited visibility into its operational data.
These indicators do not automatically mean you need a new reporting platform. They are reasons to assess your current processes, data, and reporting requirements first.
How JetBriks Can Help
JetBriks supports businesses evaluating Microsoft Dynamics 365 and Power Platform solutions, including ERP consulting, implementation, integration, migration, reporting, and automation requirements.
For organizations using Business Central, a reporting assessment can help identify:
The most important management reporting gaps
Opportunities to improve data consistency
Suitable Power BI reporting use cases
Existing manual reporting activities
Integration and access requirements
Priorities for a practical reporting roadmap
The recommended approach should be based on your business processes, current systems, data readiness, and measurable objectives.
Frequently Asked Questions
Can Microsoft Power BI connect with Dynamics 365 Business Central?
Yes. Business Central data can be used with Power BI through supported connection and data-access methods. The appropriate approach depends on the reporting requirements, permissions, data model, and technical configuration.
What reports can businesses create using Business Central and Power BI?
Possible reporting areas include financial performance, sales, receivables, inventory, purchasing, and operational KPIs. The available metrics depend on the data captured and the way reports are designed.
Does Power BI automatically fix inaccurate ERP data?
No. Power BI can help identify patterns and discrepancies, but reliable reporting requires appropriate data-quality controls, consistent KPI definitions, and validation of source records.
Should a business build all its dashboards at once?
Not necessarily. Starting with a high-priority reporting problem allows the business to validate the data, confirm user requirements, and measure value before expanding the reporting scope.
How should a business begin a Business Central reporting project?
Start by identifying the decisions that are difficult to make, reviewing the relevant data, defining KPIs, and selecting a focused pilot report. Validate its accuracy before expanding the solution.
Improve Visibility Across Your ERP Data
Your ERP contains valuable information, but the real benefit comes when that information helps your team make better-informed decisions.
If you use Microsoft Dynamics 365 Business Central and want to improve reporting, reduce spreadsheet dependency, or evaluate Power BI opportunities, start by reviewing your current reporting challenges and business priorities.
Discuss your Business Central and Power BI reporting requirements with JetBriks.
CTA button: Request an ERP & Reporting Consultation
Website: jetbriks.comEmail: info@www.jetbriks.com
Recommended Internal Links
Link relevant phrases in this article to existing JetBriks service pages:
Microsoft Dynamics 365 Business Central Consulting → Business Central service page
ERP Integration Services → ERP integration page
ERP Audit → ERP audit service page
Power Automate Consulting → Power Automate service page
ERP Consulting → ERP consulting page
Use the actual published page URLs and only link to pages that exist.
Image SEO
Suggested image filename: business-central-power-bi-erp-reporting.webp
Alt text: Microsoft Dynamics 365 Business Central and Power BI ERP reporting dashboard concept.
Image caption: Connect ERP data with business reporting to support more informed decisions.
